Pillars of Observability
01 Oct 2018 #prometheus #monitoring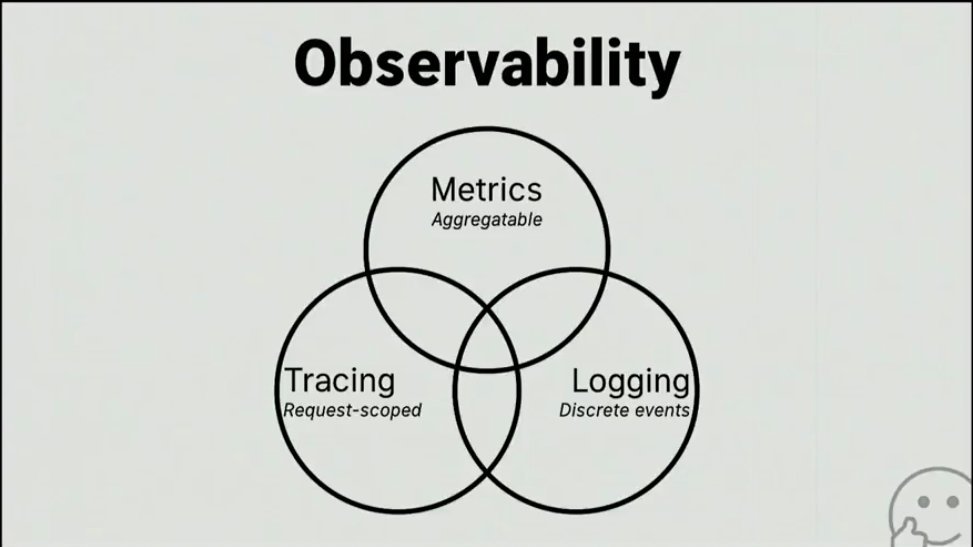
Haven’t written around for much of this year, hope it changes going down to the end of this year. This year has been very fruitful in terms of learnings and I can’t wait to share what I have learned.
This post would basically be an introduction to what I have understood by the term of observability into your infrastructure and the services which are hosted on top of it.
There are 3 pillars of observability:
-
metrics
-
logs
-
tracing
While all of them partially overlap, each have different purpose.
Metrics
These are numbers related amount of events that happened in the time range. Like:
- number of successful/failed/overall requests
- cumulative duration of requests
- bucketed histogram of requests’ durations
The main point of metrics is that these are small, you can gather them cheaply and store them for a long period of time. These give you an overall overview of the whole system, but without insights.
So, metrics answer to the question “how is my system performance changes through time?”.
I would add visualization to it too, as it goes hand in hand with metrics.
Historically people have used statsd along with graphite as the storage backend. I personally prefer prometheus. Which is an open-source, metrics-based monitoring system. It does one thing and does it pretty well, with a simple yet powerful data model and a query language which lets you analyse how your applications and infrastructure are performing.
I believe in the philosophy that
if something moves, you should track it and graph it. If it decides to make a run for it.
The thing about prometheus is that they are pretty mature in the ecosystem and have a lot of support in terms of contributors from the OSS community as well as native kubernetes metrics support. Aggregrating metrics from k8s objects is pretty straightforward with the service discovery provided by prometheus.
And they have a lot of exporters which they have written and some being supported by the community. And if one wants to instrument their code, they can use any of the client libraries to do so. Network metrics, application metrics, you name it.
Heck, a friend of mine wrote an exporter for an ISP provider, you can actually go ahead and check the metrics here
grafana can be used to visualize the data which is being scraped by prometheus (which can be added as a source to grafana), which works on a pull model.
InfluxDB is another Time series database, which would also work on a similar manner and they would have an enterprise plan for HA too, which prometheus achieves currently using thanos
Logs
These are single events that happened in the system, ex. single request. It will often contain also some information that is in the metrics (like request duration), but it will also contain more context, like IP of the requester and precise time of the request. The problem with logs isn’t that these are larger in size than just metrics itself, so you cannot store them for so long as the metrics and due to their size, you need to reduce the number of logs you send.
So, logs answers to the question “what happened in my system?”.
You can either go with a hosted solution or a SaaS-based solution for logging.
Logs are a critical part of the infra and without logs, I would say developers are just shooting in the dark when trying to debug their applications. Which makes it mission critical. I personally have experienced that going with a hosted SaaS solution, if you have a small team is something which I would suggest. As when your volumes grow, you would have to invest a lot of time to invest in fixing stuff when it breaks in the logging side. The most popular approach is pushing your logs to Elasticsearch, fluentd pushing it and kibana as the frontend. All making it stand as EFK, which is actually a pretty decent way to go about it.
But managing your ES clusters can get nasty if you are hosting them on a public cloud. Spikes on CPU during ingestion of logs is pretty common from what I have noticed. Again, depends on whether you would want to tradeoff developer time trying to fix it or move it to a SaaS based product.
If you are operating at a very large scale, it would obviously make more sense for you to host logging infra inside your infrastructure as the costs would be enormous with a SaaS product.
Facebook recently Opensourced their distributed logging platform, logdevice, last time I checked. One of their engineers mentioned in an HN comment that
LogDevice ingests over 1TB/s of uncompressed data at Facebook. The maximum limit as defined by default in the code for the number of storage nodes in a cluster is 512.
I guess you get what I am trying to put across here as a point.
Tracing
This one is for monitoring how a single event is behaving in the system. So you have information on how long this request spent in LB, backend, DB, how long it spent on external services, and so on. So as you see, this overlap with both metrics and logs, but still not exactly. The main problem is that while metrics and logs can have different formats in each of the services, tracing needs to be uniform because your system needs to be “request ID aware”. Also, traces can be very large, that is why in general you do not trace all requests, but only some of them to reduce internal traffic.
So, tracing answers to the question “how is my system components interacting with each other?”.
Opentracing is just a standard that needs services like Jaeger to implement the actual tracing. Tracing tools are about following a request as it moves between different systems.
Will be writing another post in and around metrics with prometheus shortly, Until next time!
References
- http://code.flickr.com/blog/2008/10/27/counting-timing/
- https://codeascraft.com/2011/02/15/measure-anything-measure-everything/